

Release Date :
Reference Number :
PR-202506-1845-33
Table 1. Year-on-Year Inflation Rate for All Income Households, All Items
(2018=100) in percent
| Area | May 2024 | April 2025 | May 2025 | Year-to-Date |
| Philippines | 3.9 | 1.4 | 1.3 | 1.9 |
| Negros Island Region | 4.1 | 1.5 | 1.7 | 1.9 |
| Negros Occidental | 4.2 | 2.1 | 2.4 | 2.4 |
| Bacolod City | 4.5 | 2.2 | 2.4 | 2.9 |
Source: Philippine Statistics Authority, Retail Price Survey of Commodities for the Generation of Consumer Price Index
Figure 1. Headline Inflation Rates in the province of Negros Occidental, All Items (2018=100)
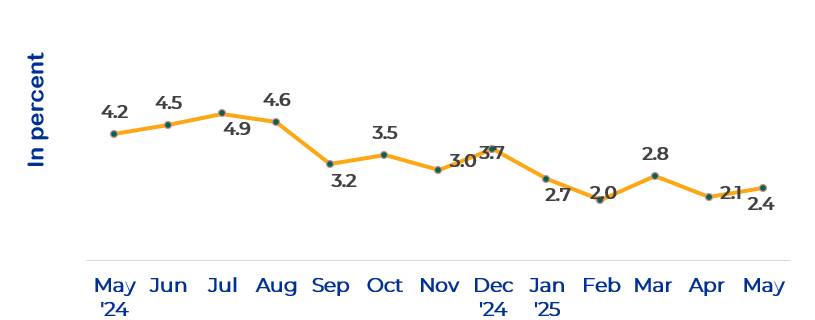
Source: Philippine Statistics Authority, Retail Price Survey of Commodities for the Generation of Consumer Price Index
1. Headline Inflation
The Philippine Statistics Authority (PSA) Negros Occidental conducts Online Press Conference on the May 2025 Inflation Report on 17 June 2025 (Tuesday), at the PSA Negros Occidental Provincial Statistics Office (PSO). PSA Negros Occidental Statistical Analyst Ligaya M. Gillesania serves as the resource person for the event.
A. Negros Occidental
Highlights of the press conference covers the Headline Inflation Rates for All Income Households in Negros Occidental increased at 2.4% in May 2025 from 2.1% in April 2025. In May 2024, the inflation rate was posted at 4.2% (Please see Table 1 and Figure 1).
The following commodity groups were the top three main sources of acceleration of the May 2025 overall inflation for All Income Households in Negros Occidental:
a. Food and Non-Alcoholic Beverages at 1.5% inflation in May from 1.3% inflation in April 2025, with 29.8% share,
b. Housing, Water, Electricity, Gas and Other Fuels at 4.2% inflation in May from 2.7% inflation in April 2025, with 28.2% share,
c. Alcoholic Beverages and Tobacco at 7.1% inflation in May from 7.9% inflation in April 2025, with 12.1% share.
Meanwhile, the following commodity groups were the top two major contributors of the May 2025 overall inflation for All Income Households in Negros Occidental:
a. Housing, Water, Electricity, Gas and Other Fuels at 4.2% inflation in May from 2.7% inflation in April 2025, with 71.5% share,
b. Food and Non-Alcoholic Beverages at 1.5% inflation in May from 1.3% inflation in April 2025, with 25.0% share.
Also, higher inflation rate was observed in the indices of Furnishings, Household Equipment, and Routine Household Maintenance at 2.3% from 2.1%, as well as Health at 3.9% from 3.7%. A reference deriving out of the data generated May from April 2025, respectively.
On the other hand, lower inflation rates were observed in the indices of Alcoholic Beverages and Tobacco at 7.1% from 7.9%, Clothing and Footwear at 5.2% from 5.4%, Transport at -1.6% from -1.0%, and Personal Care, and Miscellaneous Goods and Services at 1.8% from 2.1%. A reference deriving out of the data generated May from April 2025, respectively.
The indices for the rest of the commodity groups retained their respective previous month’s inflation, such as Information and Communication at 0.0%, Recreation, Sport and Culture at 3.1%, Education Services at 18.4%, Restaurants and Accommodation Services at 1.9%, and Financial Services at 0.0%.
Figure 2. Headline Inflation Rates in Bacolod City, All Items (2018=100)
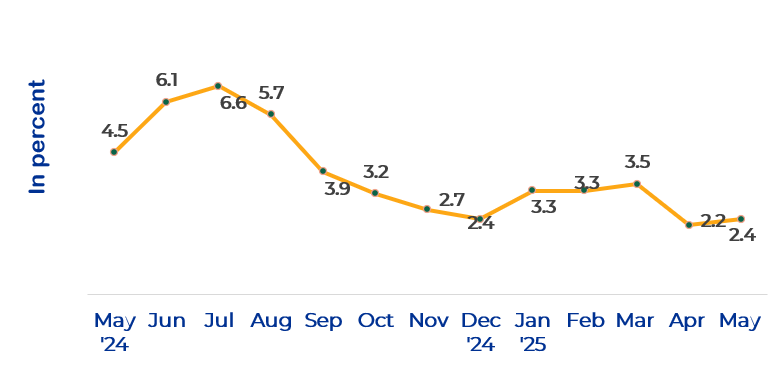
Source: Philippine Statistics Authority, Retail Price Survey of Commodities for the Generation of Consumer Price Index
B. Bacolod City
Further, the Headline Inflation Rates for All Income Households in Bacolod City increased at 2.4% in May 2025 from 2.2% in April 2025. In May 2024, the inflation rate was posted at 4.5% (Please see Table 1 and Figure 2).
The following commodity groups were the top three main sources of acceleration of the May 2025 overall inflation for All Income Households in Bacolod City:
a. Food and Non-Alcoholic Beverages at 1.5% inflation in May from 1.3% inflation in April 2025, with 21.9% share,
b. Restaurants and Accommodation Services at 6.1% inflation in both May and April 2025, with 21.7% share,
c. Education Services at 14.9% inflation in both May and April 2025, with 20.5% share.
Meanwhile, the following commodity groups were the top three major contributors of the May 2025 overall inflation for All Income Households in Bacolod City:
a. Housing, Water, Electricity, Gas and Other Fuels at 1.8% inflation in May from 1.2% inflation in April 2025, with 59.6% share,
b. Food and Non-Alcoholic Beverages at 1.5% inflation in May from 1.3% inflation in April 2025, with 28.8% share,
c. Health at 5.7% inflation in May from 5.1% inflation in April 2025, with 9.4% share.
Also, higher inflation rates were observed in the indices of Recreation, Sport and Culture at 5.0% from 4.9%, as well as Personal Care, and Miscellaneous Goods and Services at 5.1% from 5.0%. A reference deriving out of the data generated May from April 2025, respectively.
On the other hand, lower inflation rates were observed in the indices of Alcoholic Beverages and Tobacco 5.9% from 6.1%, Clothing and Footwear at 4.7% from 5.9%, and Transport at -4.1 from -3.5. A reference deriving out of the data generated May from April 2025, respectively.
The indices for the rest of the commodity groups retained their respective previous month’s inflation, such as Furnishings, Household Equipment, and Routine Household Maintenance at 1.9%, Information and Communication at 0.4%, Education Services at 14.9%, Restaurants and Accommodation Services at 6.1%, and Financial Services at 0.0%.
Table 2. Year-on-Year Inflation Rates of the CPI for All Income Households in Negros Occidental and Bacolod City, January 2021 to May 2025.
| Month | 2021 | 2022 | 2023 | 2024 | 2025 | |||||
| Bacolod City | Neg. Occ | Bacolod City | Neg. Occ | Bacolod City | Neg. Occ | Bacolod City | Neg. Occ | Bacolod City | Neg. Occ | |
| January | 3 | 4.1 | 3.9 | 7.6 | 12.1 | 12.2 | 2.5 | 2.2 | 3.3 | 2.7 |
| February | 4.4 | 5.8 | 3.5 | 6.3 | 11.2 | 12.4 | 3.1 | 2.3 | 3.3 | 2.0 |
| March | 5.5 | 6.4 | 4.3 | 7.3 | 8.7 | 10.8 | 3.3 | 2.3 | 3.5 | 2.8 |
| April | 4.3 | 4.5 | 4.6 | 7.7 | 8.7 | 8.8 | 3.9 | 4.4 | 2.2 | 2.1 |
| May | 5.1 | 5.2 | 4.8 | 8.2 | 7.5 | 8.3 | 4.5 | 4.2 | 2.4 | 2.4 |
| June | 5.1 | 5.1 | 5.1 | 8.2 | 6.7 | 8.1 | 6.1 | 4.5 | ||
| July | 5 | 4.6 | 4.2 | 8.4 | 6.6 | 7.6 | 6.6 | 4.9 | ||
| August | 4.8 | 5.3 | 6.3 | 8 | 5.7 | 7.9 | 5.7 | 4.6 | ||
| September | 3.2 | 5.3 | 6.8 | 7.8 | 6.4 | 7.6 | 3.9 | 3.2 | ||
| October | 5.5 | 7 | 5.7 | 6.9 | 6.4 | 7.8 | 3.2 | 3.5 | ||
| November | 4.7 | 6.1 | 8.7 | 11.1 | 4.2 | 4.7 | 2.7 | 3 | ||
| December | 4.2 | 5.9 | 9.7 | 12.3 | 4 | 3.5 | 2.4 | 3.7 | ||
Source: Philippine Statistics Authority, Retail Price Survey of Selected Commodities for the Generation of Consumer Price Index
Approved for release:
SGD JOHN F. CAMPOMANES
(Chief Statistical Specialist)
Interim Regional Director
| Attachment | Size |
|---|---|
|
|
338.88 KB |