

Release Date :
Reference Number :
SR-2025-06-1845-09
Negros Occidental’s May 2025 Inflation Rate for all income households increased to 2.4 percent with 2.4 percent Year-to-Date inflation.
Bacolod City also posted at 2.4 percent and with 2.9 Year-to-Date inflation.
Table.1
| Area | May 2024 | April 2025 | May 2025 | Year-to-date |
| Negros Occidental | 4.2 | 2.1 | 2.4 | 2.4 |
| Bacolod City | 4.5 | 2.2 | 2.4 | 2.9 |
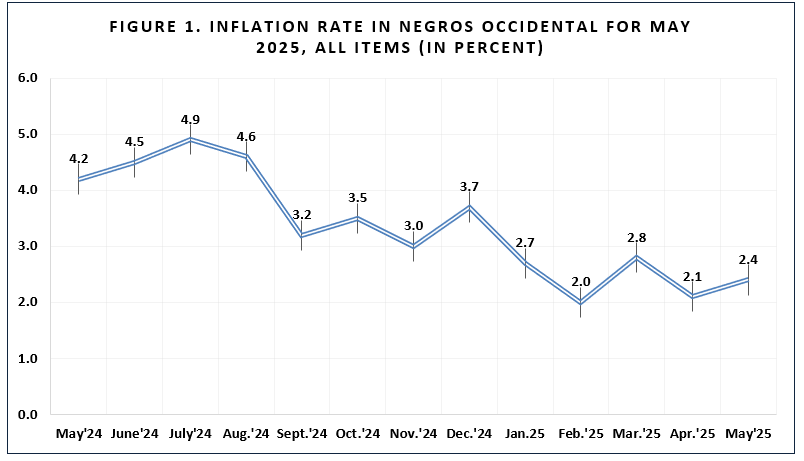
Negros Occidental’s Inflation Rate for all income household increased to 2.4 percent compared to previous month’s rate of 2.1 percent and declined against May 2024 with 4.2 percent (Please see Figure 1).
Some commodities have a positive annual growth rate like; Food and Non-Alcoholic Beverages at 1.5 percent from 1.3 percent in April 2025, Housing/Water/Electricity/Gas & Other Fuels at 4.2 percent from 2.7 percent, Furnishing/household Equipment and Routine Maintenance at 2.3 percent from 2.1 percent, Health at 3.9 percent from 3.7 percent. While these commodities manifest a negative growth rate in May 2025; Alcoholic Beverages & Tobacco at 7.1 percent from 7.9 percent in April 2025, Clothing and Footwear at 5.2 percent from 5.4 percent, Transport at (-1.6) percent from (-1.0) percent, and Personal Care & Miscellaneous Goods and Services at 1.8 percent from 2.1 percent. (See Figure 2)
The indices of the rest of the commodities retained their previous month’s annual growth rates. 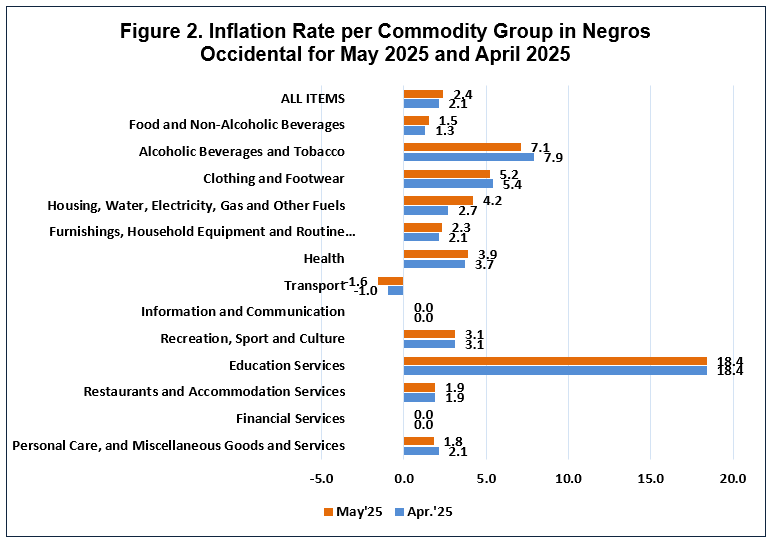
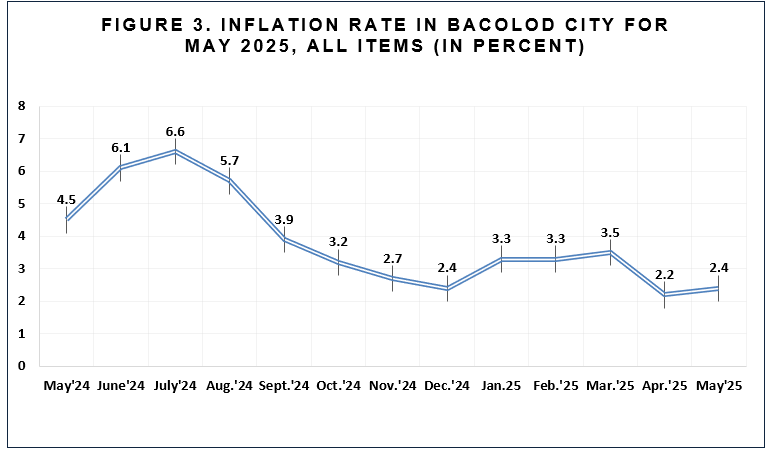
In Bacolod City, the Inflation Rate for All Income Households increased to 2.4 percent from 2.2 percent in April 2025 and against last year May 2024 at 4.5 percent. (See Figure 3.). The increase on the year-on-year inflation rate was attributed by a positive indices in some commodities like; Food and Non-Alcoholic Beverages at 1.5 percent from 1.3 percent, Housing/Water/Electricity/Gas and Other Fuels at 1.8 percent from 1.2 percent, Health at 5.7 percent from 5.1 percent, Recreation/Sports and Culture at 5.0 percent from 4.9 percent, and Personal Care & Miscellaneous Goods and Services at 5.1 percent from 5.0 percent.
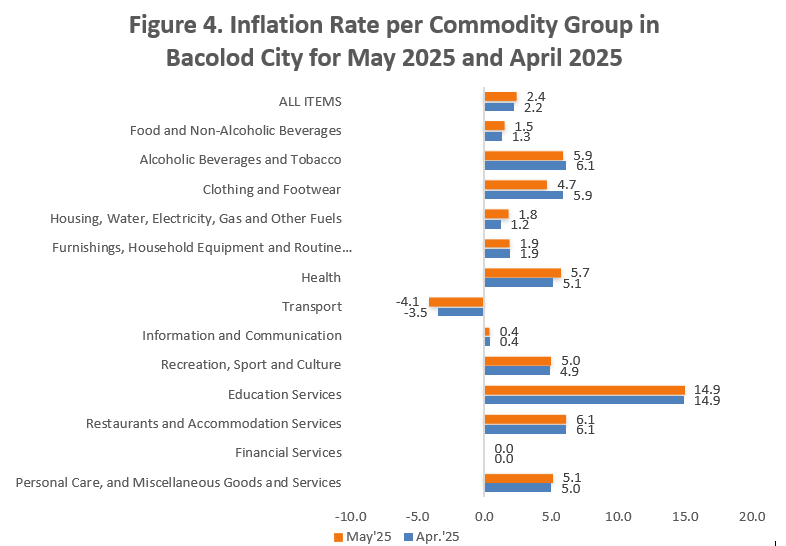
Relative to their annual rates, lower inflation was observed in some commodities like:, Alcoholic Beverages and Tobacco at 5.9 percent from 6.1 percent, Clothing & Footwear at 4.7 percent from 5.9 percent, Transport at (-4.1) percent from (-3.5) percent in April 2025
The indices of the rest of the commodities retained their previous month’s annual growth rates. (See Figure 4)
Food & Non-Alcoholic Beverages inflation, in Negros Occidental’s monthly increase on the seasonally adjusted CPI for May 2025 resulted to a slight rise up in inflation at 1.5 percent from 1.3 percent in April 2025 and decline against May 2024 with 6.6 percent. Bacolod City also exhibited an increase to 1.5 percent from 1.3 percent in April 2025 and decline against last year of the same month with 6.1 percent.
| Table 2. Food & Non-Alcoholic Beverages Inflation for May 2025 (in percent) | |||
| Area | May 2024 | April 2025 | May 2025 |
| Negros Occidental | 6.6 | 1.3 | 1.5 |
| Bacolod City | 6.1 | 1.3 | 1.5 |
Negros Occidental’s Annual growth rate for the seasonally adjusted Consumer price Index (CPI) for May 2025, exhibited an increase in some food commodities like; Cereals & Cereals Products at (-1.5) percent from (-1.9) percent in April 2025, Rice at (-2.3) percent from (-2.8) percent, Flour/Bread and Other Bakery Products, Pasta Products and Other Cereals at 0.9 percent from 0.8 percent, Fish and Other Seafoods at 2.3 percent from 0.1 percent, Oils & Fats at (-1.4) percent from (-3.3) percent, Fruits & Nuts at 3.2 percent from 0.3 percent, Sugar/Confectionery and Desserts at (-0.6) percent from (-0.7) percent, Ready-Made Food and Other Food Products N.E.C. at 2.5 percent from 2.4 percent, and Non- Alcoholic Beverages at 3.9 percent from 3.1 percent.
Annual rates of decreases were recorded in the following food commodities like: Corn at 1.8 percent from 2.2 percent, Meat and Other Parts of Slaughtered Land Animals at 3.2 percent from 3.3 percent, and Vegetables/Tubers/Cooking Bananas and Pulses at 3.8 percent from 8.8 percent. (See Table 3)
| Table 3. Foods & Non-Alcoholic Beverages- Negros Occidental | April 2025 | May 2025 |
| Cereals and Cereal Products | -1.9 | -1.5 |
| Rice | -2.8 | -2.3 |
| Corn | 2.2 | 1.8 |
| Flour, Bread and Other Bakery Products, Pasta Products, and Other Cereals | 0.8 | 0.9 |
| Meat and Other Parts of Slaughtered Land Animals | 3.3 | 3.2 |
| Fish and Other Seafood | 0.1 | 2.3 |
| Milk, Other Dairy Products, and Eggs | 6.1 | 6.1 |
| Oils and Fats | -3.3 | -1.4 |
| Fruits and Nuts | 0.3 | 3.2 |
| Vegetables, Tubers, Cooking Bananas and Pulses | 8.8 | 3.8 |
| Sugar, Confectionery and Desserts | -0.7 | -0.6 |
| Ready-Made Food and Other Food Products N.E.C. | 2.4 | 2.5 |
| * Non-alcoholic Beverages | 3.1 | 3.9 |
In Bacolod City, year-on-year inflation slightly rise up to 1.5 percent for Food & Non-Alcoholic Beverages for the month of May 2025 the increase were noted in some commodities like; Cereals (Rice) at (-8.0) percent from (-7.4) percent, Corn at 4.6 percent from 3.7 percent, Meat and Other Parts of Slaughtered Land Animals at 2.8 percent from 2.0 percent, Fish and Other Seafoods at 9.1 percent from 6.1 percent, Milk/Other Dairy Products and Eggs at 4.2 percent from 4.1 percent, Oils & Fats at 0.2 percent from (-3.1) percent, Fruits & Nuts at 2.9 percent from (-0.4) percent, Sugar/Confectionery and Desserts at 1.0 percent from (-0.2) percent, and Non-Alcoholic Beverages at 6.5 percent from 5.6 percent.
Annual growth rates showed a decrease in the following commodities like: Cereals and Cereals Products at (-5.5) percent from (-5.1) percent, Flour/Bread, and Other Bakery Products Pasta Products and Other Cereals at 1.4 percent from 1.6 percent, Vegetables/Tubers/Cooking Bananas and Pulses at 1.4 percent from 7.1 percent, and Ready-Made Food and Other Food Products N.E.C. at 3.8 percent from 4.6 percent.
The indices of the rest of the food commodity groups still retain their annual growth rates from the previous month. (See Table 4)
| Table 4. Food and Non-Alcoholic Beverages – Bacolod City | April 2025 | May 2025 |
| Cereals and Cereal Products | -5.1 | -5.5 |
| Rice | -7.4 | -8.0 |
| Corn | 3.7 | 4.6 |
| Flour, Bread and Other Bakery Products, Pasta Products, and Other Cereals | 1.6 | 1.4 |
| Meat and Other Parts of Slaughtered Land Animals | 2.0 | 2.8 |
| Fish and Other Seafood | 6.1 | 9.1 |
| Milk, Other Dairy Products, and Eggs | 4.1 | 4.2 |
| Oils and Fats | -3.1 | 0.2 |
| Fruits and Nuts | -0.4 | 2.9 |
| Vegetables, Tubers, Cooking Bananas and Pulses | 7.1 | 1.4 |
| Sugar, Confectionery and Desserts | -0.2 | 1.0 |
| Ready-Made Food and Other Food Products N.E.C. | 4.6 | 3.8 |
| * Non-alcoholic Beverages | 5.6 | 6.5 |
Non-Food Inflation for May 2025, Negros Occidental increased to 2.7 percent from 2.3 percent in April 2025. These were noted in some commodity groups like; Housing/Water/Electricity/Gas and Other Fuels, Furnishing/Household Equipment and Routine Household Maintenance, and Health. Bacolod City, also posted at 2.7 percent from 2.6 percent in April 2025, this was due to the annual year-on-year increases in the indices of some commodities group like; Health, Recreation/Sports and Culture, and Personal Care and Miscellaneous Goods and Services. (See Table 5)
| Table 5. Non-Food | Negros Occidental | Bacolod City | ||
| April 2025 | May 2025 | April 2025 | May 2025 | |
| Non-Food | 2.3 | 2.7 | 2.6 | 2.7 |
| Clothing and Footwear | 5.4 | 5.2 | 5.9 | 4.7 |
| Housing/Water/Electricity/Gas & Others | 2.7 | 4.2 | 1.2 | 1.8 |
| Electricity, Gas & Other Fuels | 3.7 | 7.8 | -1.9 | 0.0 |
| Furnishing, Household Equipt. & maint. | 2.1 | 2.3 | 1.9 | 1.9 |
| Health | 3.7 | 3.9 | 5.1 | 5.7 |
| Transport | -1.0 | -1.6 | -3.5 | -4.1 |
| Passenger Transport Services | 1.9 | 1.7 | 0.8 | 0.7 |
| Transport Services of Goods | 0.0 | 0.0 | 0.0 | 0.0 |
| Information and Communication | 0.0 | 0.0 | 0.4 | 0.4 |
| Recreation, Sports & Culture | 3.1 | 3.1 | 4.9 | 5.0 |
| Education Services | 18.4 | 18.4 | 14.9 | 14.9 |
| Restaurant & Accommodation Services | 1.9 | 1.9 | 6.1 | 6.1 |
| Financial Services | 0.0 | 0.0 | 0.0 | 0.0 |
| Personal Care, Misc.Goods & Services | 2.1 | 1.8 | 5.0 | 5.1 |
Table 2. Year-on-Year Inflation Rates of the CPI for All Income Households in Negros Occidental and Bacolod City, January 2022 to May 2025.
| Month | 2022 | 2023 | 2024 | 2025 | ||||
| Bacolod City | NegOcc | Bacolod City | NegOcc | Bacolod City | NegOcc | Bacolod City | NegOcc | |
| January | 3.9 | 7.6 | 12.1 | 12.2 | 2.5 | 2.2 | 3.3 | 2.7 |
| February | 3.5 | 6.3 | 11.2 | 12.4 | 3.1 | 2.3 | 3.3 | 2.0 |
| March | 4.3 | 7.3 | 8.7 | 10.8 | 3.3 | 2.3 | 3.5 | 2.8 |
| April | 4.6 | 7.7 | 8.7 | 8.8 | 3.9 | 4.4 | 2.2 | 2.1 |
| May | 4.8 | 8.2 | 7.5 | 8.3 | 4.5 | 4.2 | 2.4 | 2.4 |
| June | 5.1 | 8.2 | 6.7 | 8.1 | 6.1 | 4.5 | ||
| July | 4.2 | 8.4 | 6.6 | 7.6 | 6.6 | 4.9 | ||
| August | 6.3 | 8 | 5.7 | 7.9 | 5.7 | 4.6 | ||
| September | 6.8 | 7.8 | 6.4 | 7.6 | 3.9 | 3.2 | ||
| October | 5.7 | 6.9 | 6.4 | 7.8 | 3.2 | 3.5 | ||
| November | 8.7 | 11.1 | 4.2 | 4.7 | 2.7 | 3 | ||
| December | 9.7 | 12.3 | 4 | 3.5 | 2.4 | 3.7 | ||
Approved for Release.
SGD DIESAH S. BIAOCO
(Supervising Statistical Specialist)
Officer-in-Charge
PSO-Negros Occidental
| Attachment | Size |
|---|---|
|
|
532.89 KB |