

Release Date :
Reference Number :
2025-SR61-019
Philippines
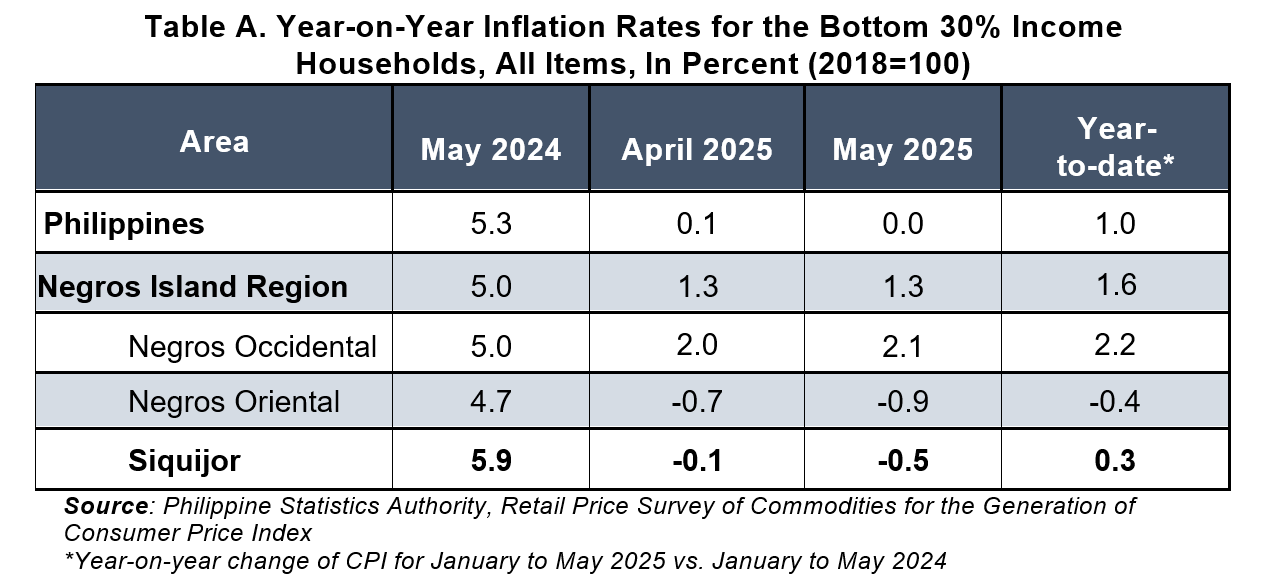
Inflation rate for the bottom 30% income households in the recorded at zero percent in May 2025 from 0.1 percent in April 2025. This brings the national average inflation rate for this income group from January to May 2025 to 1.0 percent. In May 2024, the inflation rate was at 5.3 percent. (Table A)
The main driver to the downward trend of the overall inflation for the bottom 30% income households during the month was the faster annual decline in the index of the heavily weighted food and non-alcoholic beverages at -1.6 percent from -1.2 percent in April 2025. Moreover, faster annual decline was also observed in the transport index at -1.9 percent during the month from -1.4 percent in the previous month. Additionally, slower annual growth rate was noted in the index of clothing and footwear at 1.3 percent from 1.6 percent. (Source: https://psa.gov.ph/content/summary-inflation-report-consumer-price-index-bottom-30-income-households-2018100-may-2025)
Negros Island Region (NIR)
Inflation for the bottom 30% income households in the Negros Island Region posted at 1.3 percent in May 2025 retaining the previous month’s record. This brings the national average inflation rate for this income group from January to May 2025 to 1.6 percent. In May 2024, the inflation rate was at 5.0 percent.
During the month, only the Province of Negros Occidental recorded an increase in the overall inflation for the bottom 30% income households at 2.1 percent from 2.0 percent in April 2025. Meanwhile, the Province of Negros Oriental and Siquijor posted a decrease in the overall inflation for this income group at -0.9 percent and -0.5 percent, respectively. (Table A)
- Province of Siquijor
Overall Inflation
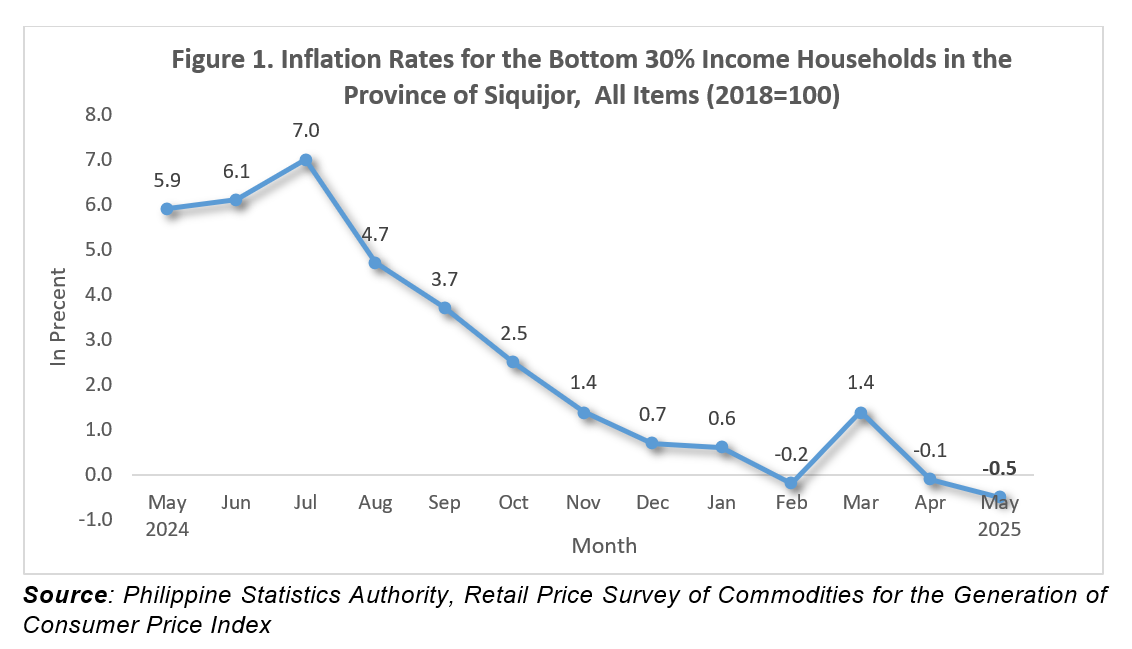
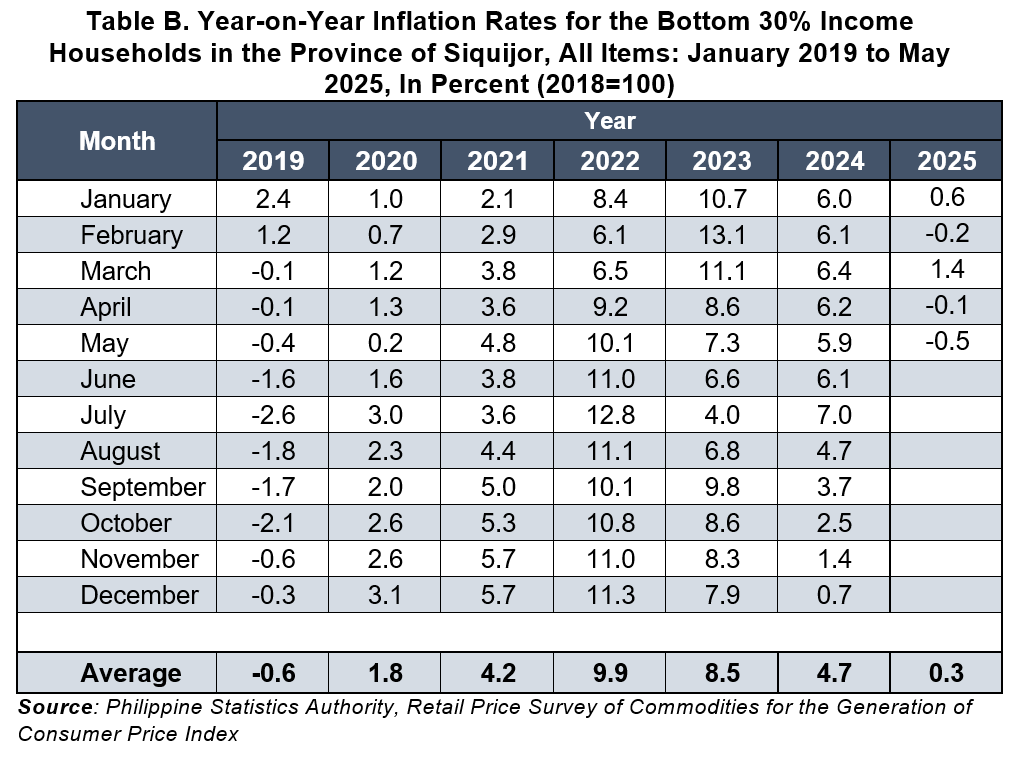
The province’s inflation rate in May 2025 for the bottom 30% income households continued to decline further to -0.5 percent -0.1 percent in April 2025. This brings the average inflation rate for this income group in the province from January to May 2025 to 0.3 percent. In May 2025, the inflation rate was observed at 5.9 percent. (Table A & B and Figure 1)
1.1 Main Drivers to the Downward Trend of the Overall Inflation
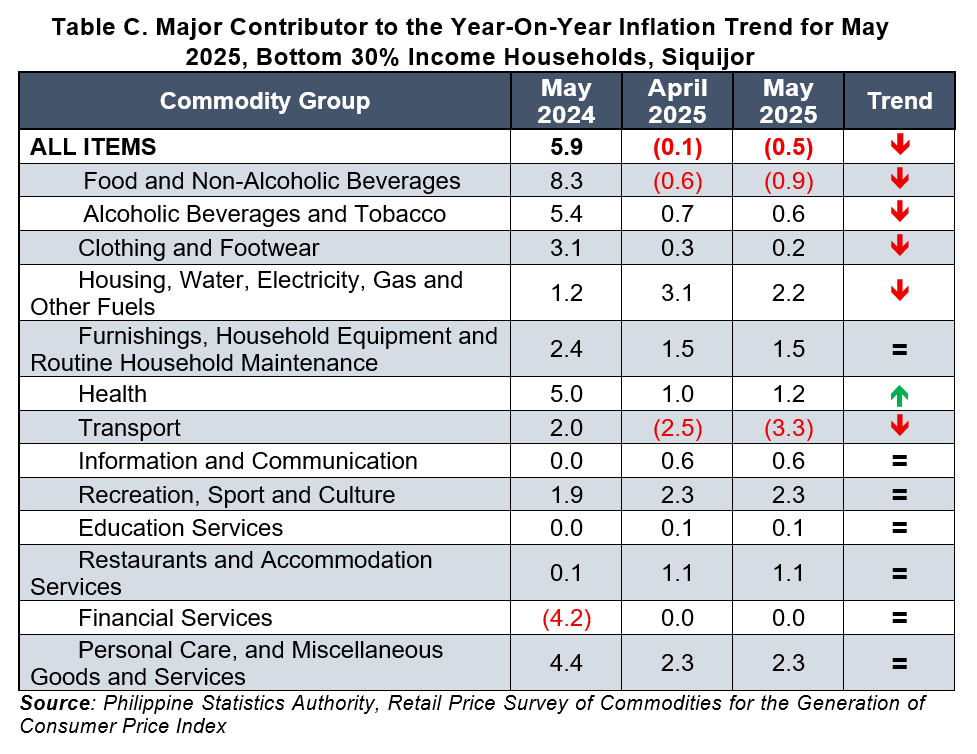
The downward trend of the overall inflation for the bottom 30% income households in May 2025 was brought about by the faster decline on the year-on-year growth in heavily weighted food and non-alcoholic beverages at -0.9 percent from -0.6 percent in April 2025. Slower increase in the index of housing, water, electricity, gas and other fuels in May 2025 at 2.2 percent from 3.1 percent in April 2025 also contributed to the downward trend of the overall inflation in this income group. Additionally, there was a faster decline in the index of transport at -3.3 percent during the month from -2.5 percent in April 2025. (Table C, 3 & 4)
Moreover, slower annual growth rates were noted in the indices of the following commodity groups in May 2025:
- clothing and footwear, 0.2 percent from 0.3 percent; and
- alcoholic beverages and tobacco, 0.6 percent from 0.7 percent. (Table C, 3 & 4)
In contrast, index of health incline faster from 1.0 percent in April 2025 to 1.2 percent in May 2025. (Table C, 3 & 4)
Meanwhile, the indices of the following commodity groups retained their respective previous month’s annual growth rates.
- furnishings, household equipment and routine household maintenance, 1.5 percent;
- information and communication, 0.6 percent;
- recreation, sport and culture, 2.3 percent;
- education services, 0.1 percent;
- restaurants and accommodation services; 1.1 percent;
- financial services, 0.0 percent; and
- personal care, and miscellaneous goods and services, 2.3 percent. (Table C, 3 & 4)
1.2 Main Contributors to the Headline Inflation
The main contributors to the May 2025 overall inflation for the bottom 30% income households in the province were the following:
- food and non-alcoholic beverages with 130.5 percent share or -0.65 percentage point;
- transport with 69.0 percent share or -0.34 percentage point; and
- financial services with 0.0 percent share or 0.00 percentage point.
Food Inflation
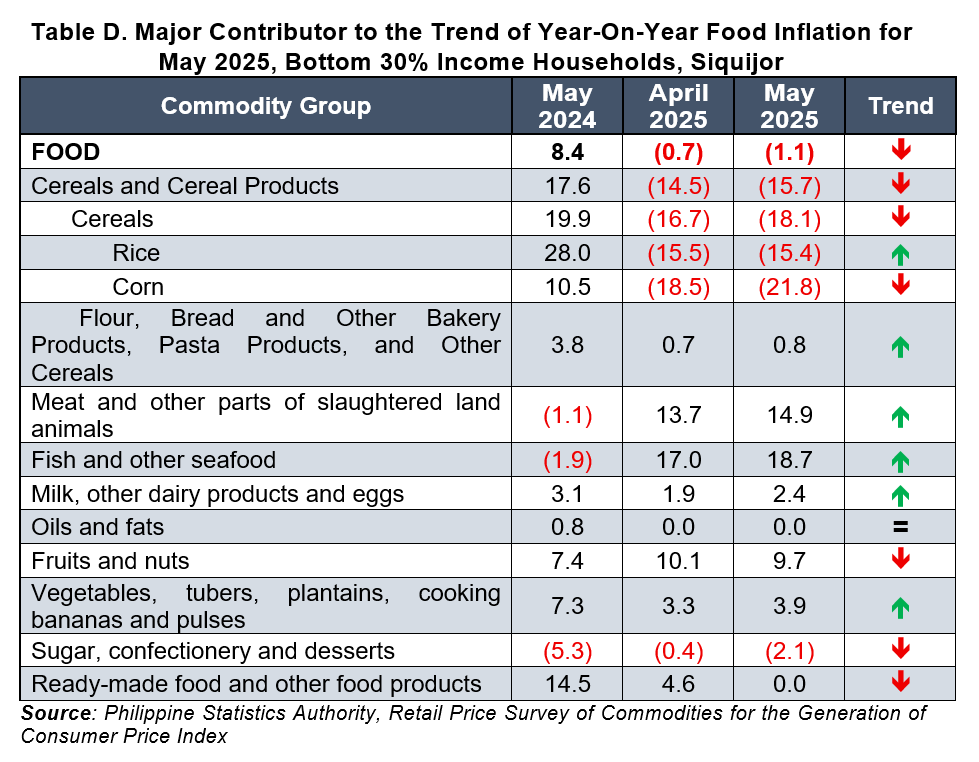
Food inflation for the bottom 30% income households at the provincial level decline further in May 2025 at -1.1 percent from -0.7 percent April 2025. In May 2024, food inflation was posted at 8.4 percent. (Table D, 9)
2.1 Main Drivers to the Downward Trend of the Food Inflation
The decline of food inflation in May 2025 was primarily brought about by the faster decline of corn index at -21.8 percent from -18.5 percent in April 2025. Moreover, the faster annual decreases in the indices of ready-made food and other food products at 0.0 percent during the month from 4.6 percent in April 2025, and sugar, confectionery and desserts at -2.1 percent from the annual decline of -0.4 percent in the previous month also contributed to the downward trend of the overall inflation. (Table D, 5 & 9)
Also, slower growth rate in the index of fruits and nuts was also noted during the month at 9.7 percent from 10.1 percent in April 2025. (Table D, 5 & 9)
In contrast, higher annual increases in the following indices were observed during the month compared to the previous month’s record:
- Rice, -15.4 percent from -15.5 percent;
- flour, bread and other bakery products, pasta products, and other cereals, 0.8 percent from 0.7 percent;
- meat and other parts of slaughtered land animals, 14.9 percent from 13.7 percent;
- fish and other seafood, 18.7 percent from 17.0 percent;
- milk, other dairy products and eggs, 2.4 percent from 1.9 percent; and
- vegetables, tubers, plantains, cooking bananas and pulses, 3.9 percent from 3.3 percent. (Table D, 5 & 9)
The index of oils and fats retained its previous month’s annual growth rate of 0.0 percent. (Table D, 5 & 9)
2.2 Main Contributors to the Food Inflation
Among the food groups, the main contributors for the food inflation during the month were the following:
- cereal and cereal products which includes rice, corn and flour, bread and other bakery products, pasta products, and other cereals with 626.0 percent share or -6.89 percentage point;
- sugar, confectionery and desserts with 5.1 percent share or -0.06 percentage point; and
- oils and fats and ready-made food and other food products both with 0.0 percent share or 0.00 percentage point.
TECHNICAL NOTES
Consumer Price Index (CPI)
The CPI is an indicator of the change in the average retail prices of a fixed basket of goods and services commonly purchased by households relative to a base year.
Bottom 30% Household
Families that belong in the low-income bracket and the most vulnerable to economic and social difficulties. Based on the “relative poverty” concept, a household whose per capita income falls below the bottom 30% of the cumulative per capita distribution belongs to the low-income group.
One of the common characteristics of households in this income group is that expenditures on food items account for a more substantial proportion of expenditures compared to expenditures on other items. Price changes in food, therefore, would be expected to greatly affect this income group more than any other group.
Uses of CPI
- The CPI is most widely used in the calculation of the inflation rate and purchasing power of peso. It is a major statistical series used for economic analysis and as monitoring indicator of the government economic policy.
- Measures the composite change in the consumer prices in various commodities overtime.
Computation of CPI
The computation of CPI involves consideration of the following important points:
- Base Period – The reference date or base period is the benchmark or reference date or period at which the index is taken as equal to 100.
- Market Basket – A sample of the thousands of varieties of goods purchased for consumption and the services availed by the households in the country selected to represent the composite price behavior of all goods and services purchased by consumers.
- Weighting System - The weighting pattern uses the expenditures on various consumer items purchased by households as a proportion to total expenditure.
- Formula - The formula used in computing the CPI is the weighted arithmetic mean of price relatives, the Laspeyre’s formula with a fixed base year period (2018) weights.
- Geographic Coverage – CPI values are computed at the national, regional, and provincial levels, and or selected cities.
Inflation Rate
The inflation rate is the annual rate of change, or the year-on-year change of CPI expressed in percent. Inflation is interpreted in terms of declining purchasing power of money.
Note: Statistical tables in excel file are provided as an attachment of this release.
(SGD) JOSELITO C. MAGHANOY
(Supervising Statistical Specialist)/
Officer-in-Charge