

Release Date :
Reference Number :
2025-SR61-026
Inventory of Livestock Commodities (Heads) of Siquijor Province
January to December 2024
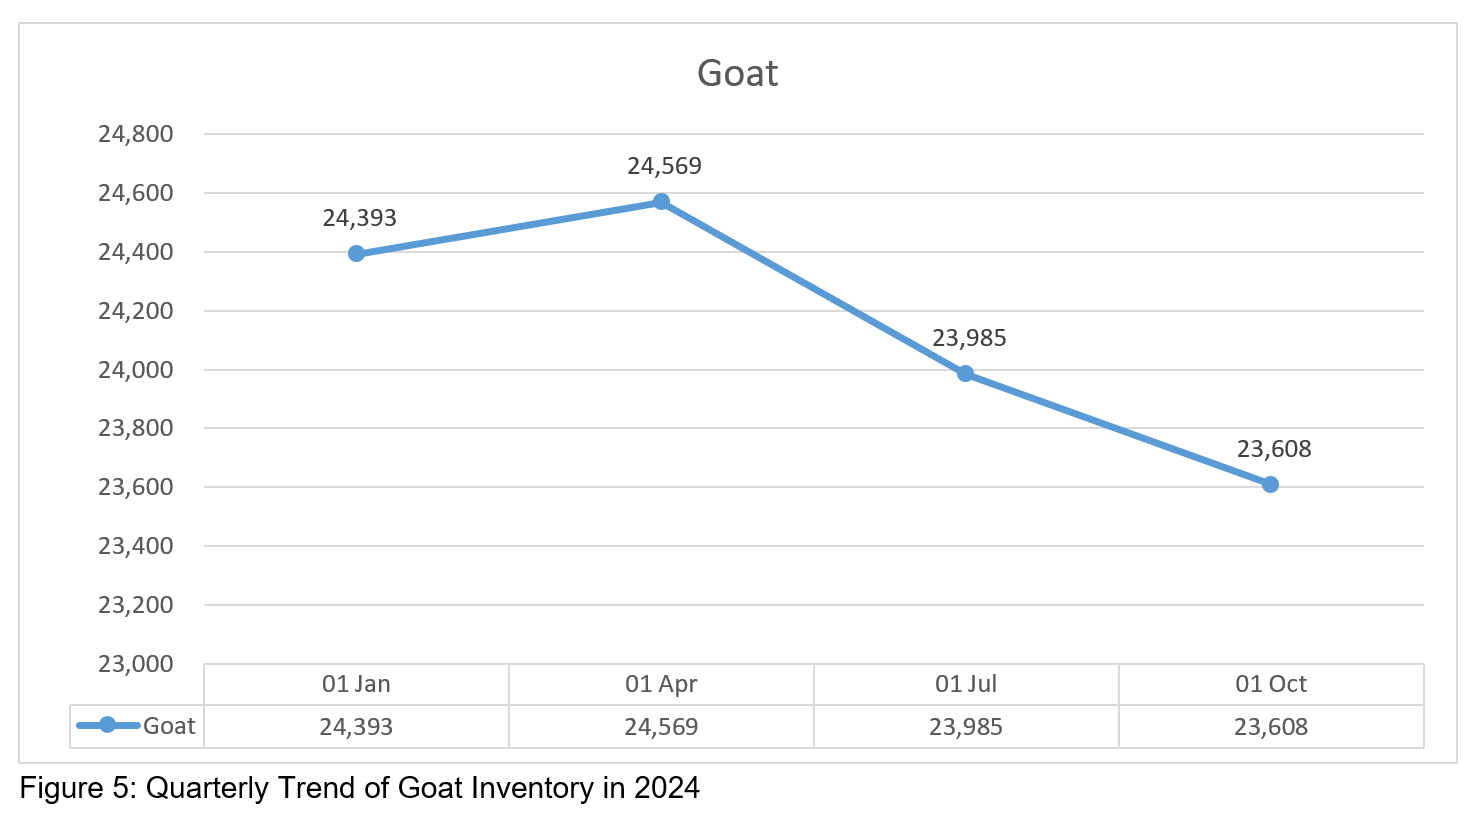
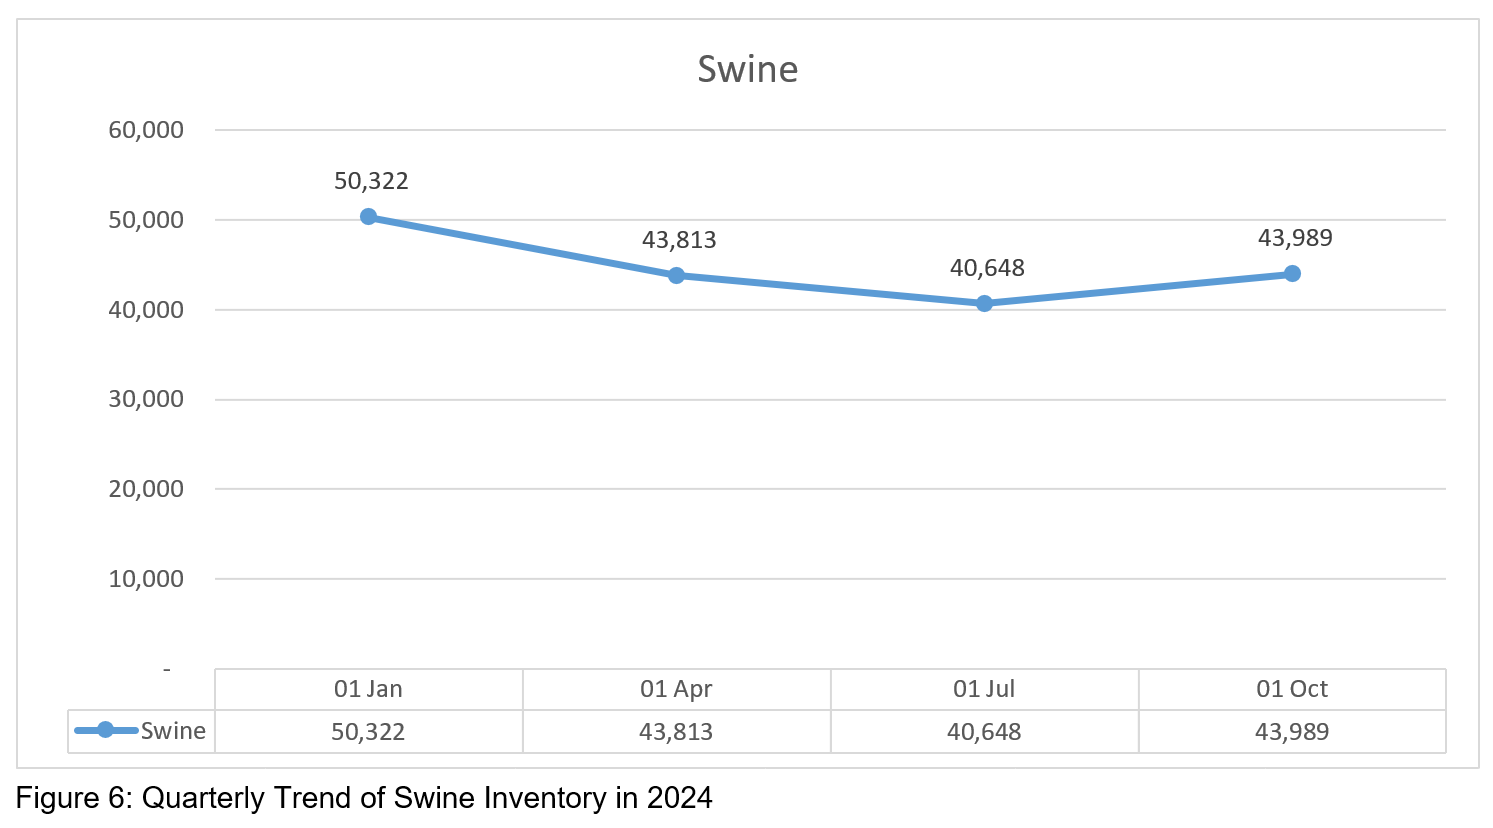
The bar graph presents the annual livestock inventory in Siquijor Province for January to December 2024. The analysis of the inventory throughout the year are as follows: Carabao: Showed a consistent decrease throughout the year, from 1,092 in January to 1,071 in October 2024. This represents a small but steady decreased. Cattle: Showed decrease from January to April, in January it had 22,104 to 22,033 in April followed by a relatively increase in inventory from July that had 22,058 to 22,224 in October 2024. Goat: Showed a slight increase from January to April, in January it had 24,393 to 24,569 in April but showed decrease from July that had 23,985 to 23,608 in October 2024. While swine: Shows a substantial decreased from January to July, from 50,322 in January, 43,813 in April to 40,648 in July and showed slight increase in October that had 43,989 heads. The decrease in carabao inventory was due to various factors, including natural mortality, disease, or a shift in agricultural practices. The increases in cattle, goats, and swine were attributed to successful breeding programs, improved animal husbandry, increased demand or favorable market conditions.
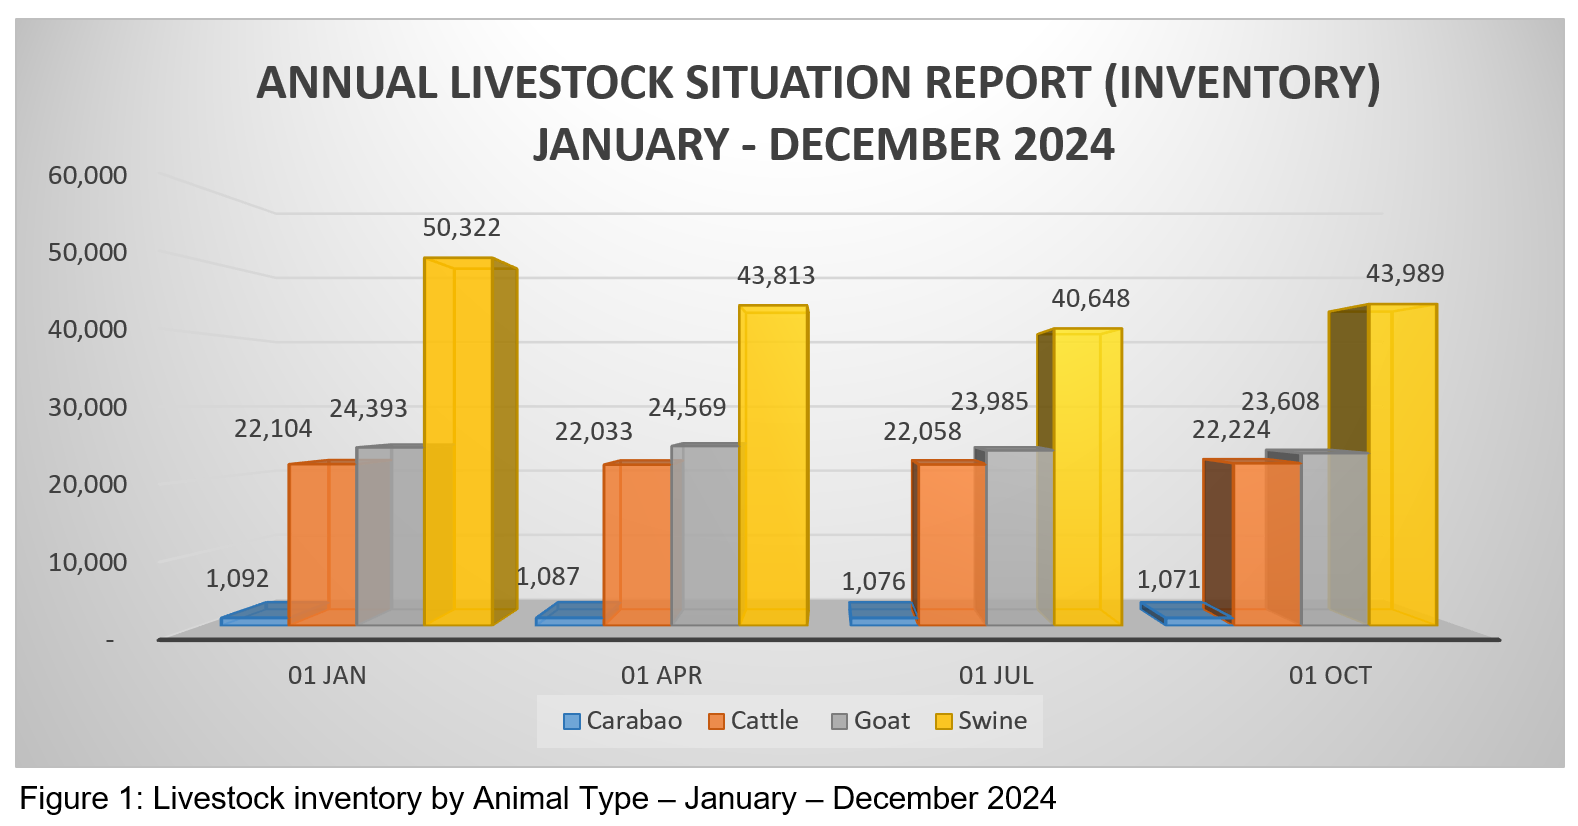
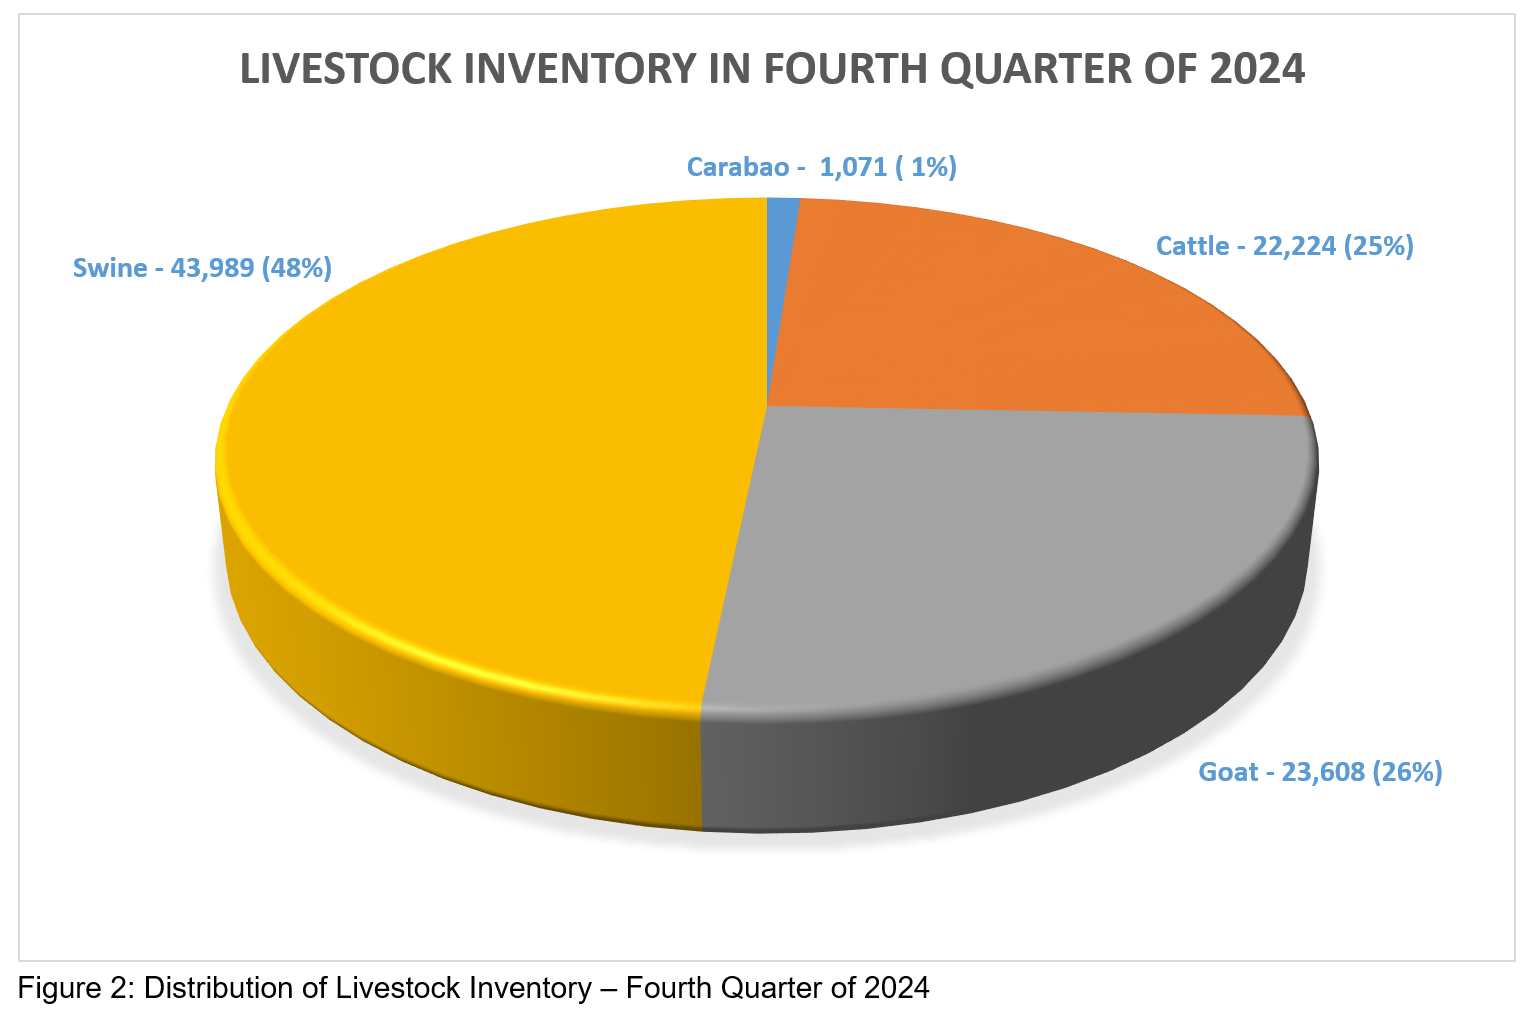
Figure 2 shows the distribution of livestock inventory in the province in percentage share as of fourth quarter of 2024. Swine had accounted the largest portion of inventory comprising 48 percent with a total estimated inventory of 43,989 heads followed by goat at 26 percent with a total inventory of 23,608 heads, cattle at 25 percent share with 22,224 heads and lastly carabao that had only 1 percent share with a total of 1,071 heads.
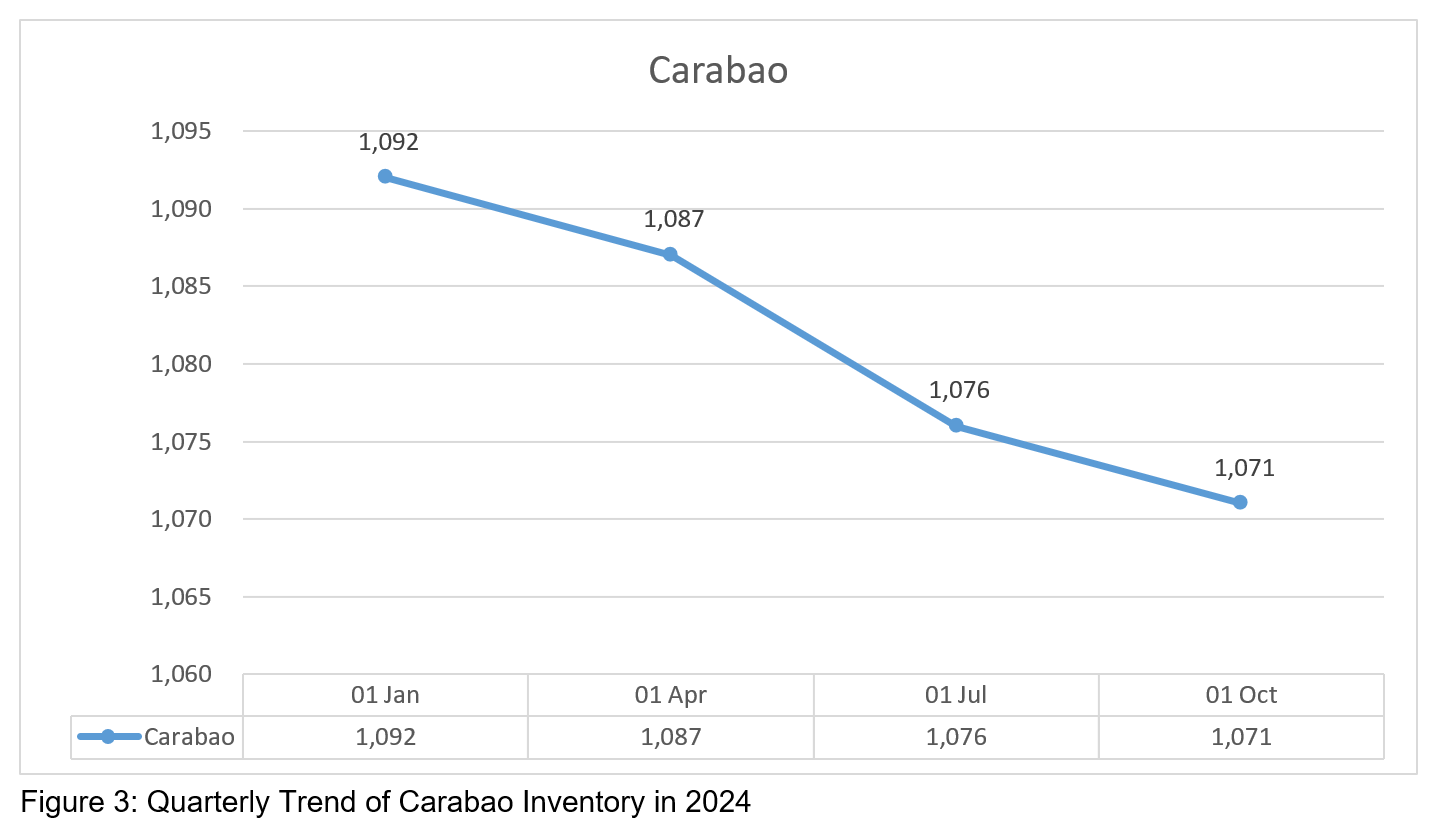
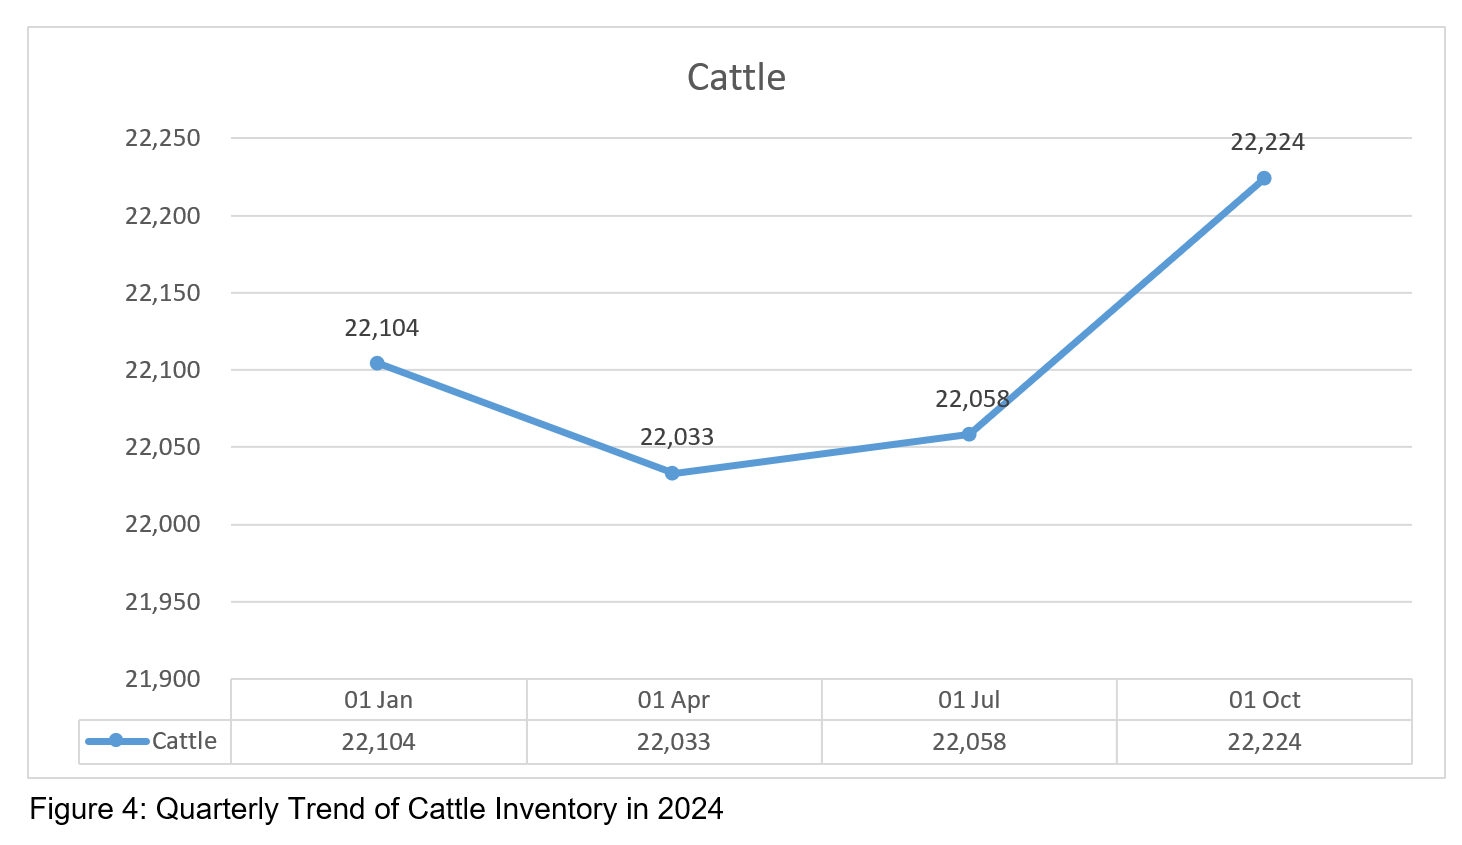
Figures 3 to 6 show the quarterly trend of inventory for livestock animals from first quarter to fourth quarter of 2024. Carabao showed significant downtrend starting from first quarter up to fourth quarter of 2024, in which 1,092 as the highest estimate of inventory. While cattle showed downtrend from 01 January to 01 April 2024, it slightly went up on 01 July up to 01 October in which 22,224 was the highest estimate of inventory. Meanwhile, goat had its biggest downtrend from 24,393 in 01 January to 23,608 in 01 October and showed downtrend starting from 01 April with 24,569 to 01 October with 23,608 estimate of inventory. On the other hand, swine showed downtrend from 01 January with 50,322 estimate of inventory up to 40,648 in 01 July 2024 and showed slight uptrend up to 43,989 estimate of inventory in 01 October 2024.
Livestock
Farm animals kept or raised for consumption and work. For purposes of census and surveys, livestock covers only those that are tended and raised by households and establishments.
Slaughterhouse
The premises that are approved and registered by a controlling authority in which food animals are slaughtered for human consumption.
Volume of Production
The number of tended/raised animals disposed for slaughter including animals shipped-out for slaughter (liveweight equivalent).
Animal Inventory
The actual number of animals (in head) present in the farm as of a specific reference data regardless of ownership.
Another source that supplements the data requirements of the Livestock and Poultry sector is the Compilation of Data Slaughterhouses and Poultry Dressing Plants (CDSPDP). This is done monthly and utilizes administrative data from Locally Registered Meat Establishments (LRMEs) in the province which is in coordination with the Provincial Veterinary Office (PVO) and Meat Inspectors (MIs) of the Local Government Unit (LGU).
(SGD) JOSELITO C. MAGHANOY
(Supervising Statistical Specialist)/
Officer-in-Charge
| Attachment | Size |
|---|---|
|
|
1.37 MB |